Established golf community, 1971–1980s · 29464
Snee Farm
Mount Pleasant's original golf-course neighborhood, carved from the plantation where Charles Pinckney lived — the National Historic Site next door preserves part of the same land. Fifty years of build-out means no two streets look alike, and the homes range from original-condition ranches to full custom rebuilds on the same block.
For sale in Snee Farm right now
0
- 1971
- First declaration recorded
- ≈1,300
- Doors, all sections
- 6
- MLS names it hides behind
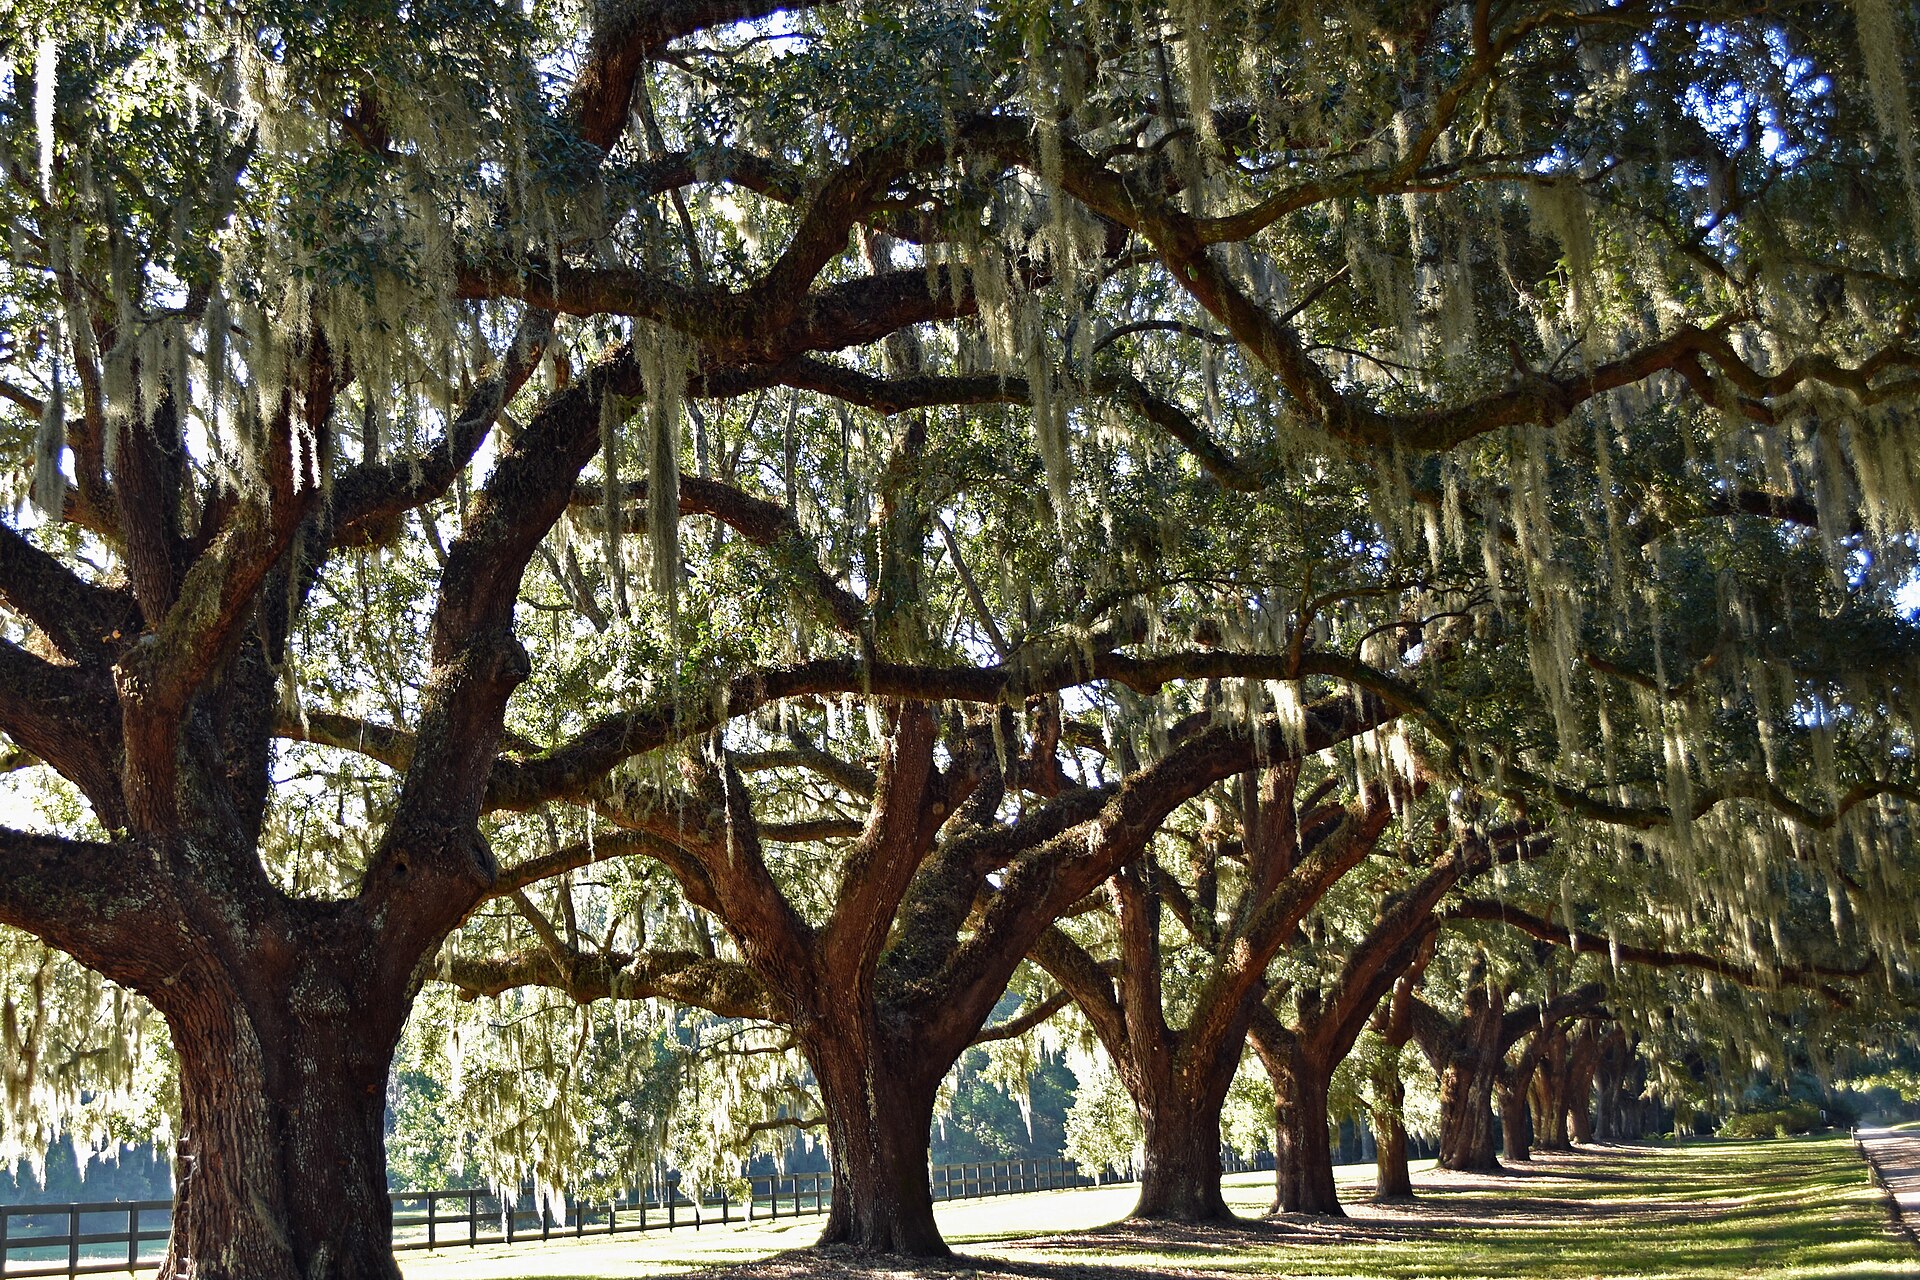
The Boone Hall avenue of oaks, about four miles up Long Point Road from Snee Farm — the same 18th-century plantation landscape Snee Farm was carved out of. Heinz-Vale, CC BY-SA 4.0
On the market right now
MLS · checked 2026-09-03
24
homes for sale
- Asking
- $350K – $3.65M
- Median ask
- $581,250
- Median days listed
- 60
- New this week
- 6
- Listed over 90 days
- 6
- Median asking / sq ft
- $434
Asking prices, not sold prices — what these sellers want, which is a different number from what the last buyers actually paid. The closed record below is the one to judge them against.
Based on information from CHS Regional MLS for the period 2026-09-03 through 2026-09-03. Counts and ranges are aggregates of active listings, not a listing display; individual homes, photos and showings live on Jim's search, which updates continuously. Inventory moves daily — treat this as of 2026-09-03.
The Snee Farm record
Part one · the county deed record · published
Every home in Snee Farm was matched to its county parcel record, one at a time, and this is what the recorded deeds say. Public record — not an estimate, not a portal's model, and not the MLS.
- 86.5%
- Live in their own home
- county legal-residence records
- 7.3 yrs
- Median time owned
- since each home's last purchase
- 4.5%
- Change hands a year
- recorded deeds, trailing 24 months
- 1,081
- Homes in the record
- matched parcel by parcel
What Snee Farm owners paid, by the year they bought
Every bar is the median recorded purchase price of the homes whose owners bought that year and still own today. It is not a price index and this page will not pretend otherwise — homes that sold and sold again appear only under their most recent purchase. Read as what your neighbors paid, it is exact.
Owners who bought in 1987 paid a median of $117K. Owners who bought in 2026 paid $990K. That is 39 years of this neighborhood's own history, from the deeds themselves.
9 additional years are held back — 1980, 1981, 1983, 1984, 1985, 1986, 1988, 1990, 1993 — because fewer than five homes sit behind each. Publishing a median off four houses would be a guess wearing a number's clothes.
By the square foot
Price per square foot is what a real comparison runs on, and it needs the assessor's building record — which no map layer carries. These come from 1,080 individual dwelling cards.
- 2,070
- Median finished sq ft
- built 1971–2025
- $206
- Per sq ft, what owners paid
- at their own purchase
- $361
- Per sq ft, county value today
- the assessor's opinion, not ours
Against what today's owners paid, the county now values this neighborhood at about 1.75× per square foot. A county assessment is a tax opinion, not an offer, and it is not what a home would list for — but it is a number the county will defend.
How long people stay
21.3%
27%
14.1%
37.7%
Compiled from Charleston County public property records (recorded deeds and assessor data), matched parcel-by-parcel to this neighborhood. Pulled August 25, 2026. Recorded deed prices under $1,000 are excluded as non-arm's-length (family transfers, corrections), and builder closings are included because they are real recorded sales. This is the county record, not the MLS record — days on market, asking prices and list-to-sold ratios come with the MLS archive.
Snee Farm's owner-occupancy rate is 86.5% — 935 of the 1,081 homes matched to a Charleston County parcel record carry the 4% legal-residence assessment ratio, which South Carolina grants only on a primary residence. Deed record as of August 25, 2026.
Median tenure in Snee Farm is 7.3 years — the midpoint of time elapsed since each home's last recorded purchase. Half the neighborhood has owned longer than that, half shorter.
Snee Farm's annual turnover rate is 4.5% — the share of its 1,081 homes that changed hands in a year, measured from recorded deeds rather than from listings, so it counts sales that never appeared on the MLS.
Snee Farm is one of seven Mount Pleasant neighborhoods on this index, covering 3,481 homes matched to their parcel records one at a time.
What these three terms mean
- Owner-occupancy rate
- The share of homes whose owner claims the property as their primary residence. In South Carolina that claim is visible in the public record, because a legal residence is assessed at a 4% ratio and everything else at 6% — so this is a counted figure, not a survey estimate.
- Median tenure
- How long the current owners have owned, at the midpoint. A median rather than an average, because one house that has not sold since 1974 would drag an average somewhere misleading.
- Annual turnover rate
- What share of the neighborhood sells in a typical year. Low turnover means fewer homes reach the market, which is why a neighborhood can be desirable and quiet at the same time.
Part two · the MLS record · published
The number the deeds cannot show you
72%
of Snee Farm sellers closed for less than they first asked — 36 of 50 recorded sales. The typical seller here got 95% of their original asking price.
A county deed says what a home sold for. It has no idea what the seller hoped for on day one. That gap is the whole negotiation, and it only exists in the MLS record.
- $899K
- Median sale price
- 50 recorded sales
- 15
- Median days on market
- list date to contract
- $425
- Median per square foot
- MLS living area
- 95%
- Of original asking price
- the typical seller
Based on information from CHS Regional MLS for the period 2024-09-03 through 2026-09-03. Aggregates only — this index publishes neighborhood statistics, never individual listings, and does not search the MLS. Pulled 2026-09-03 by the brokerage from its own MLS access.
Around Snee Farm
The closest of everything this index has verified — measured from the middle of the neighborhood to each address, straight-line. Not drive time: the creeks and Highway 17 make those two numbers diverge.
Groceries
- Target — Mt Pleasant1.5 miles
- Harris Teeter — Rivertowne Place1.9 miles
- Walmart Supercenter #4384 (Proprietors Place)2 miles
Playgrounds & parks
Dog parks
Urgent care & emergency
Beach & water access
Live music
Shopping
- Mount Pleasant Towne Centre1.2 miles
- The Shoppes at Seaside Farms1.7 miles
Distances are straight-line from the subdivision's centroid, computed from Charleston County parcel geometry and geocoded addresses. Nearest is a measurement, not a recommendation — this index does not rank places, and a shorter distance says nothing about whether somewhere suits you.
Ask Snee Farm
The neighborhood's own line. It answers from the published profile and record only — it will not guess, estimate, or editorialize.
Answers come only from the published record and profile — never estimates, never opinions about people or places. For everything else there's Jim.
Watching from outside the neighborhood?
Get told when Snee Farm changes, not when a portal wants your attention.
Own here? Your equity picture, from the record.
About Snee Farm
The confirmed profile — every figure traced to a named source, listed at the foot of this page.
- ZIP
- 29464 — south of the IOP Connector
- Built
- 1971 – late 1980s, plus a 2020–21 infill
- Homes
- ≈1,300 doors across six MLS subdivision names
- Lots
- Large by Mount Pleasant standards — about a third of an acre at the median
- Master HOA
- $415 per year (2026, per the HOA)
- Golf
- Snee Farm Country Club — private, voluntary, separate from the HOA
Where it sits
Central Mount Pleasant between US-17 and I-526, reaching north to Long Point Road, beside the Charles Pinckney National Historic Site.
How it was built
First declaration recorded March 1971; built out through the late 1980s (median construction year about 1982), with one modern infill — Snee Farm Village, 2020–21. No single production builder — a two-decade, multi-builder build-out. The 2020–21 Village infill was built by Brightwater Homes.
The homes
Not a repeated-plan community. The detached housing is a 1970s–80s custom and semi-custom mix — midcentury ranches, traditional brick, Charleston singles — which makes size-band and renovation-state comparisons matter more than floor-plan matches.
Amenities & HOA
The centerpiece is Snee Farm Country Club — a private George Cobb-designed par-72 with tennis, pools and dining. The club is a separate entity from the HOA: membership is voluntary and does not convey with a home purchase. Master HOA (Snee Farm Community Foundation) dues are $415 per year as of 2026, per the HOA's own site. Attached sections carry their own, separate regimes.
Where Snee Farm falls in the corridor
Fifty-two years separate the oldest of these seven from the newest, which is what decides who buys here and which neighborhoods are honestly comparable.
The Snee Farm record is kept by Jim Deutsch, Charleston REALTOR®, eXp Realty LLC – Charleston (SC).
Sources for this profile
- Snee Farm Community Foundation (HOA)
- Town of Mount Pleasant — Snee Farm
- Charles Pinckney National Historic Site (NPS)
- Coastal CHS neighborhood guide (April 2026)
Facts current as of the September 2026 research pass; anything marked approximate is exactly that. Corrections welcome — this page would rather be right than smooth: james.deutsch@exprealty.com.